Built for the way you trade futures

Footprint charts, volume profiles and replay.
Built for index futures on Windows.

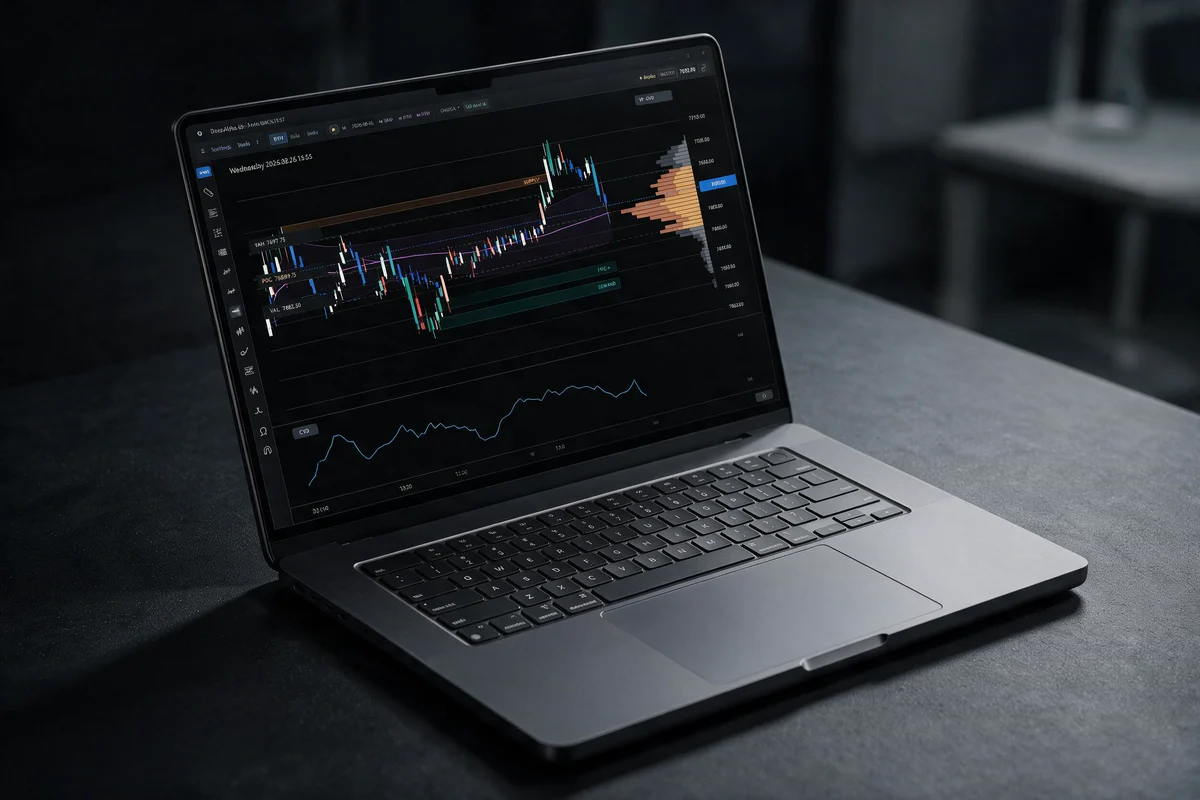
DeepAlpha order-flow chart: ES futures, session levels, volume profile and cumulative delta
Built for WindowsNQ, MNQ, ES & MESCurrently in private testing

Order-flow charts for futures

Market structure and chart signals

Chart appearance
Chart colours

Market structure

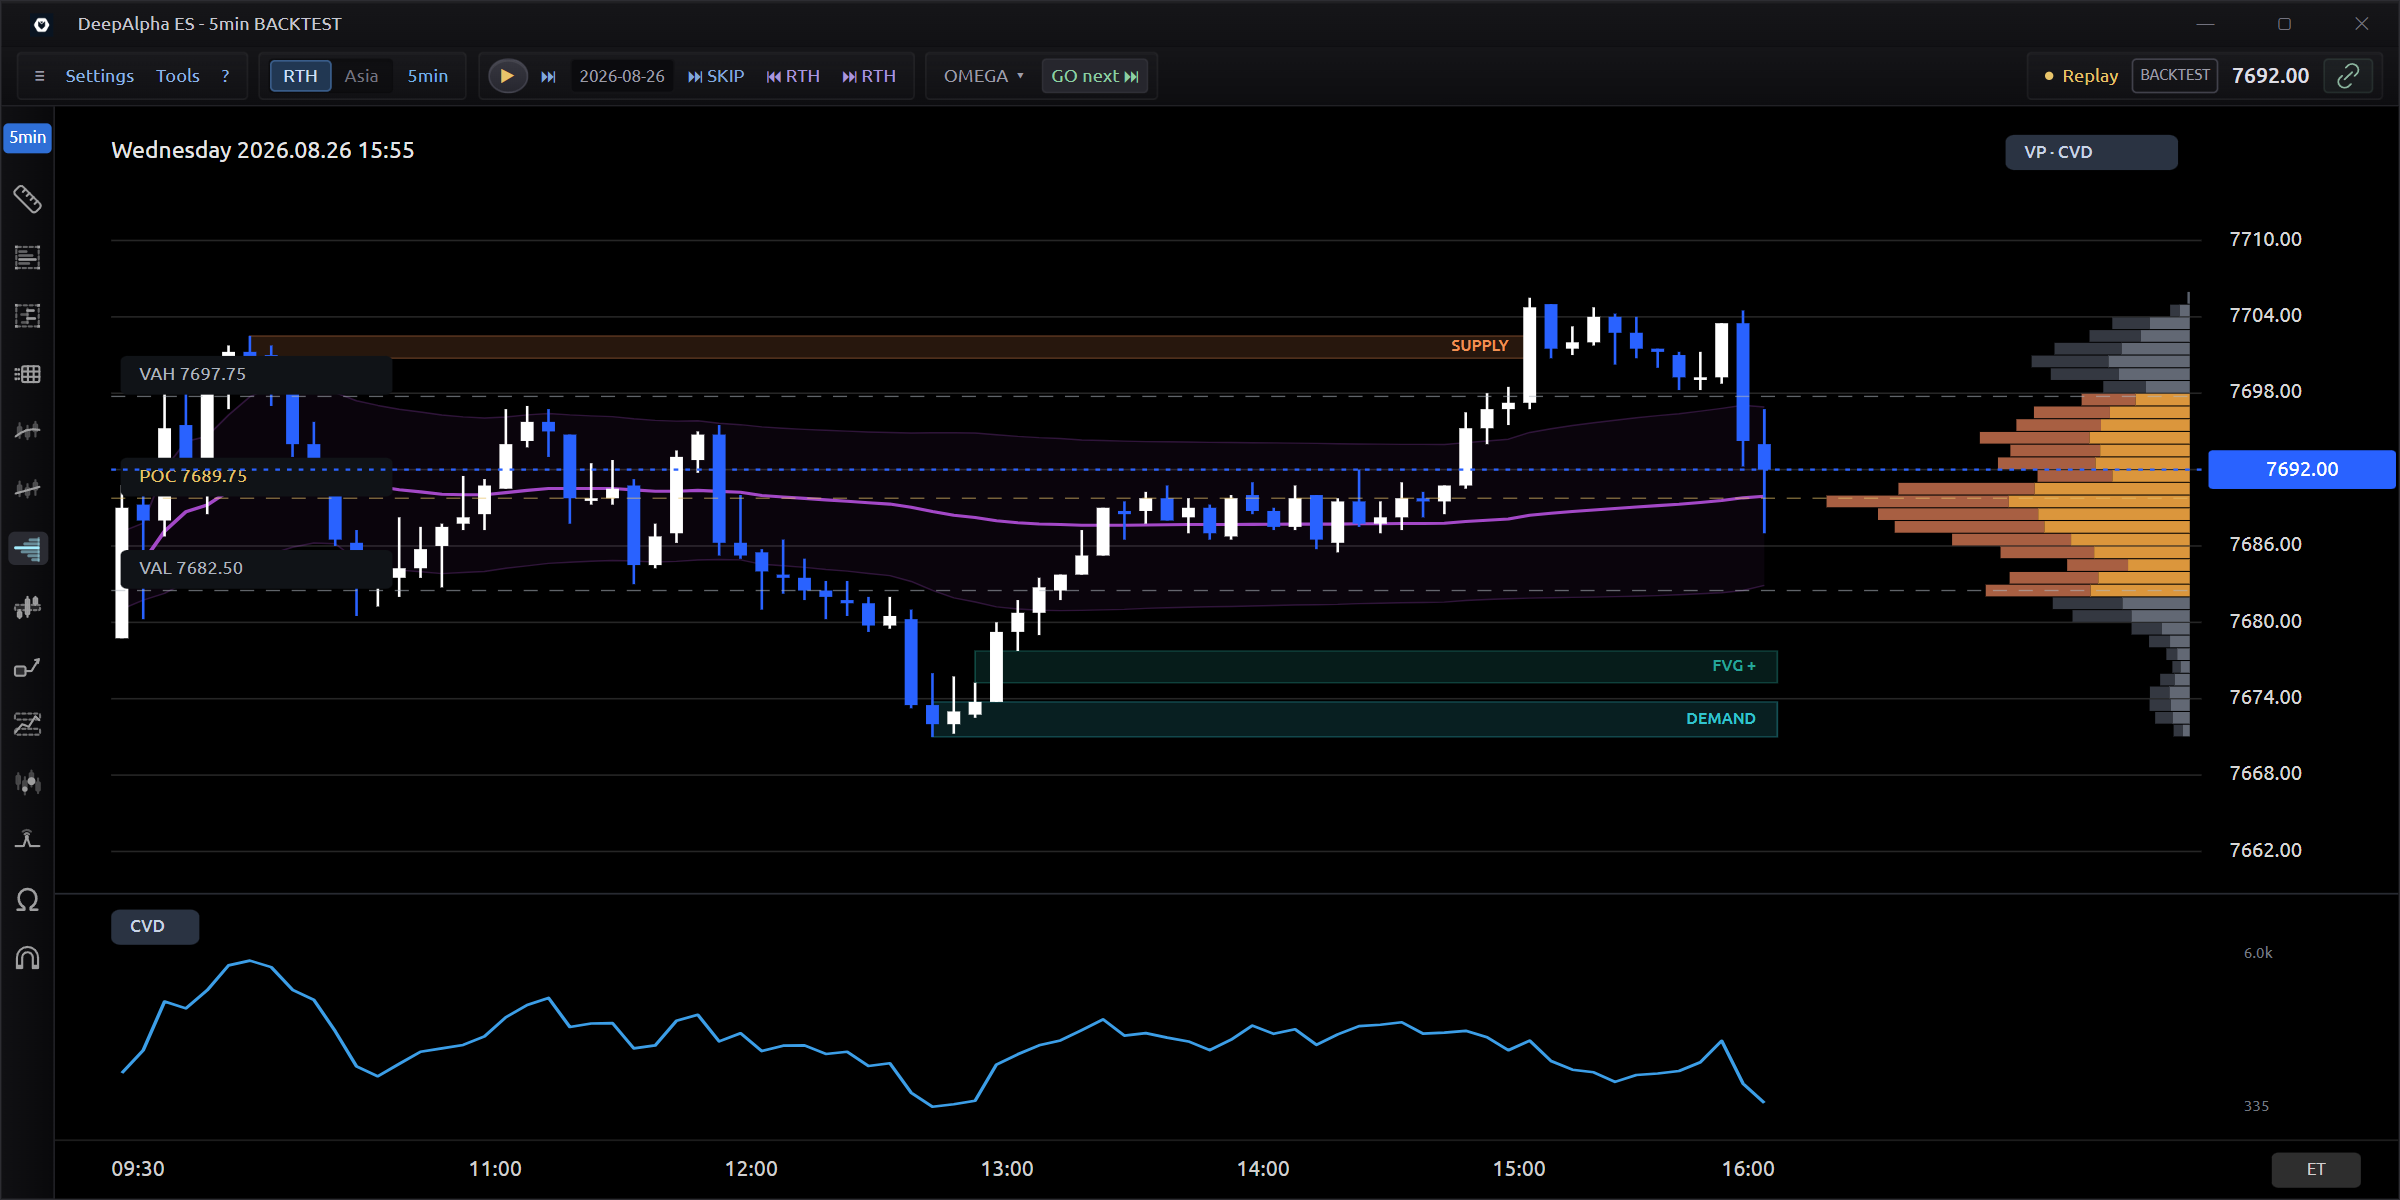
Mark supply and demand zones, fair value gaps and session levels on the chart. Follow how price reacts to these areas across timeframes.

  • Supply and demand zones
  • Fair value gaps and order blocks
  • Session levels and VWAP
  • Studies across multiple timeframes

Delta &
cumulative delta

Compare price movement with net buying and selling volume. View delta for each candle and cumulative delta for the session in a separate pane.

  • Bid, ask and delta by candle
  • Session totals and delta percentages
  • Cumulative delta alongside price

Chart signals

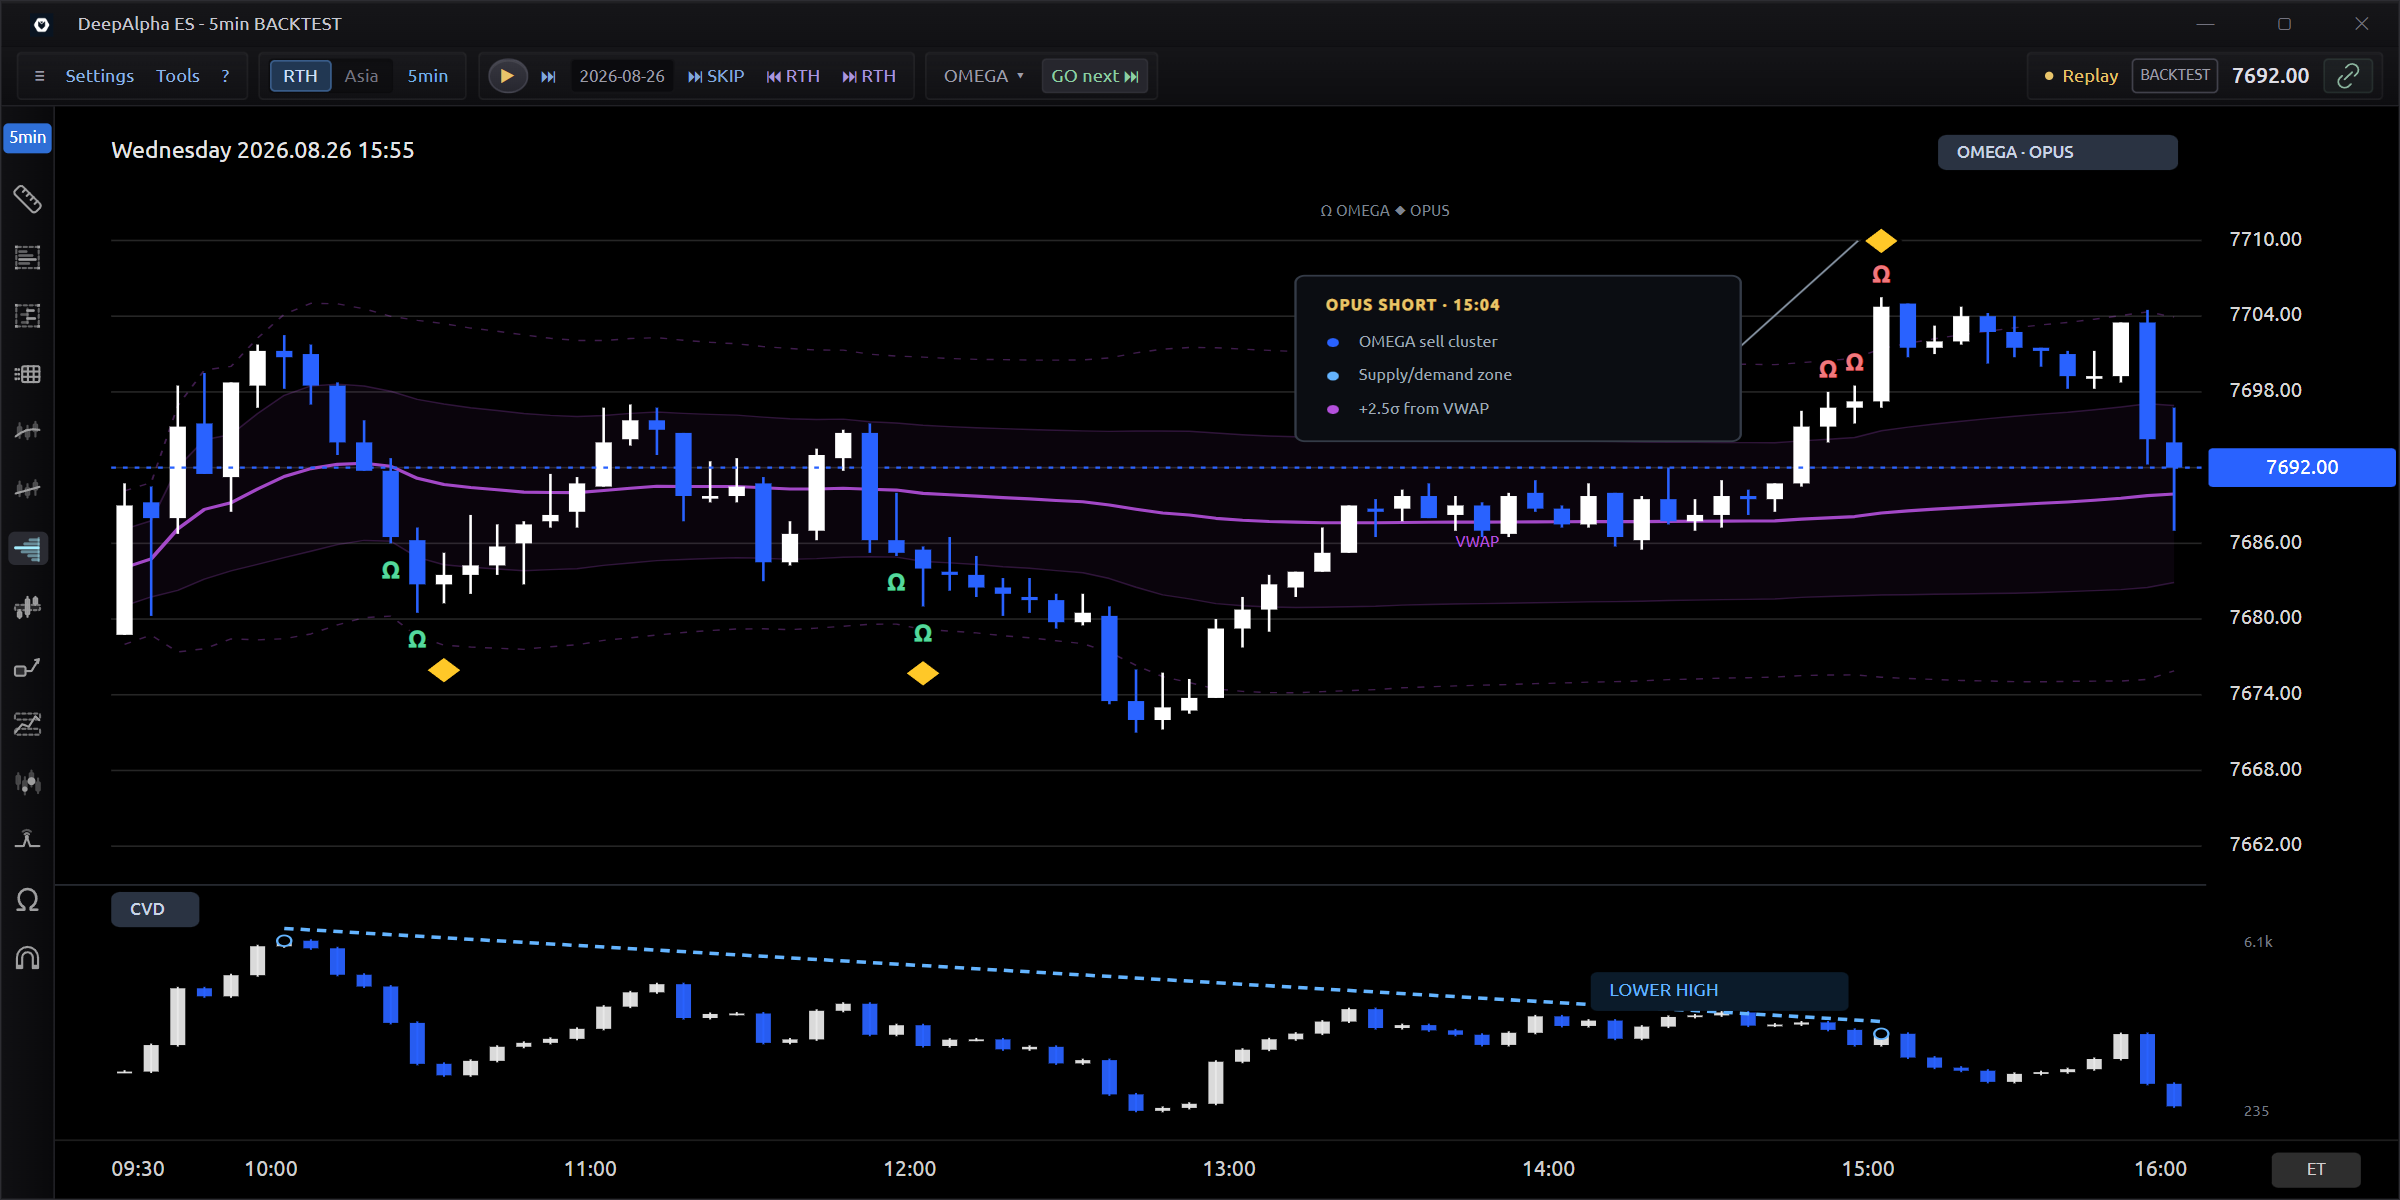
Display study signals directly at their price levels. Check each marker against order flow and market structure, then review it in replay.

  • Signal markers anchored to price
  • Order-flow and structure context
  • Historical review through replay

Discover the
DeepAlpha platform.

Order-flow tools

Inspect volume, mark session levels and measure price moves with tools built into the chart.

Chart appearance
Chart colours

AlphaFlip zones

AlphaFlip uses tick data to build range bars and mark changes in aggressive order flow at pivots. Green zones mark a shift to buying; red zones mark a shift to selling. Keep each zone in view when price returns to test it.

  • AlphaFlip zones
  • Built from tick data
  • Live on retest

Session levels

Plot the previous session’s high, low, close and value area alongside the 15-minute opening range. Compare current price with these labelled reference levels.

  • Prior-day levels
  • Prior-day value area
  • 15-minute opening range

Footprint on hover

Hover over a candle to inspect bid and ask volume at each price. Highlight imbalances, stacked imbalances and absorption without changing chart views.

  • Footprint on hover
  • Footprint on zoom
  • 3× and 7× imbalances

Range profiles

Drag over a chart range to build its volume and delta profiles. Compare volume by price, with the point of control and value area marked.

  • Volume profile (drag)
  • Delta profile (drag)
  • POC · VAH · VAL

Big trades

Group trades printed together on the same side into a single bubble at their average price. Bubble size represents contract volume; green marks trades at the ask and red marks trades at the bid.

  • Big trades
  • Size threshold
  • Bubble or label mode

Absorption

Identify heavy aggressive volume at a candle’s high or low with limited price follow-through. Footprint labels mark these areas as ABS SELL at highs and ABS BUY at lows.

  • Absorption flags
  • Stacked imbalances
  • Point of control

Chart measurement

Drag between two chart points to measure the price change in points and percent, elapsed bars and time, and traded delta across the range.

  • Measure (drag)
  • Delta table (drag)

Position sizing

Practise in the simulator with a fixed contract size, dollar risk or percentage of account value. Adjust stops and exits on the chart, hide future bars and apply prop-firm rule presets.

  • Order ticket
  • Draggable stop and exits
  • Hide future bars
  • Prop-firm rule presets

Bar statistics

View ask volume, bid volume, delta, delta as a percentage of volume and session delta beneath each candle. Choose which rows to show in the statistics grid.

  • STAT grid
  • CVD and session CVD
  • Tape speed

Additional tools

  • Session profiles for Asia, London and RTH
  • Per-bar profiles and merged composites
  • VWAP with ±1, ±2 and ±3σ bands, and TWAP
  • EMA 9/21 and Bollinger Bands
  • Order blocks and wick clusters
  • Big trades with a minimum-size filter
  • Economic calendar on the time axis
  • Replay in 1 to 30 second steps
  • Random start day with dates hidden
  • MAE, MFE and trade history
  • Export sessions to PNG, PDF and JSON
  • Keyboard shortcuts, themes and per-window colours

Chart updates
on Telegram

Receive market updates and chart snapshots through DeepAlpha Sentinel. Review your charts in Telegram when you are away from the desktop.

Get early access Sentinel availability will be confirmed at launch.
DEEPALPHA SENTINEL
ES chart update

View the latest ES snapshot with session levels and active studies.

DeepAlpha chart thumbnail inside an illustrative Sentinel notification

Illustrative notification · Interface preview

DeepAlpha
Read bid and ask volume at every price, with footprint, profiles and delta.
DeepAlpha
Keep session levels and market structure in view as price moves between them.
DeepAlpha
Replay a session at your own pace. Practise each trade, then review it.
DeepAlpha
A Windows workspace for NQ, MNQ, ES and MES. Built around index futures.

Frequently asked
questions

Access, markets and platform requirements.

What is DeepAlpha?

DeepAlpha is a Windows charting platform for index futures. It includes footprint charts, volume profiles, delta, cumulative delta, market structure studies and historical replay.

Which markets does it cover?

The current application focuses on Nasdaq and S&P 500 index futures, including NQ, MNQ, ES and MES. Chart timeframes range from one minute to daily.

Can I use it today?

DeepAlpha is currently in private testing. Join the early-access list to receive availability and launch updates. Joining the list does not create a paid subscription or guarantee immediate access.

Is this a desktop or browser platform?

DeepAlpha is a native desktop application. The current application runs on Windows; platform availability and setup requirements will be confirmed before public access.

Does it include replay and simulated trading?

Yes. Replay historical sessions, practise entries, stops and targets in the simulator, and review your trade history. Simulated results are not live trading performance.

Are signals automatic trading instructions?

No. DeepAlpha's studies and signals provide context for your own analysis and decisions. They do not guarantee profits. Trading futures involves risk, and historical or simulated outcomes do not predict future results.

What will access and market data cost?

Public pricing, access terms and market-data arrangements have not been announced. Details will be shared before public access so you can review the complete requirements.

Currently in private testing

Get early access
to DeepAlpha

Join the waitlist for availability and launch updates.

No payment required. Read our .

Waitlist privacy

The early-access form sends your email address to DeepAlpha's waitlist service, hosted on Cloudflare. The service also stores the submission time, browser user-agent and country supplied by Cloudflare.

The list is used for DeepAlpha early-access and launch communications. Joining the list is not a purchase or a paid subscription. Only submit an address you own and want to use for these updates.

This notice describes the current waitlist form. Public access terms and further privacy information will be provided before the product launches.

Risk information

Futures trading involves substantial risk and may not be suitable for every trader. You are responsible for assessing risks and making your own trading decisions.

DeepAlpha provides charts and decision-support tools. Signals do not guarantee any result. Historical, hypothetical and simulated results are not a reliable indication of future performance.

Examples on this page demonstrate product features and study concepts. They are not recommendations to enter any position.